
Understanding Star Schema in Power BI: The Complete Guide
Data Concepts Series

If you’re looking for mentoring on Power BI, Microsoft Fabric, AI, and building a career in the modern data profession, you can connect with me here:
https://topmate.io/analyticalguy
Your CEO asks a simple question:
“What’s our total revenue?”
Three people give three different answers.
$10.5 million
$9.8 million
$11.2 million
Which one is correct?
This chaos happens because you don’t have a proper data model.
But there’s a solution: Star Schema.
In this post, I’ll break down exactly why Star Schema matters, how to build one in Power BI, and why it’s the foundation of every professional data warehouse.
If you would like to watch the video instead of reading, you can watch it here:
Why Star Schema Matters (The Real Problem)
Let me show you what happens without a star schema.
Your Data (All Mixed Together)
Orders Table (No Structure):
order_id: 1001
customer_name: “John Doe”
customer_email: “john@email.com“
product_name: “MacBook Pro”
product_category: “Electronics”
product_price: $1,999
order_amount: $1,999
order_date: 2024-01-15
The Problem
When a product category changes from “Electronics” to “Consumer Tech”, where do you update it?
Orders table? (50,000 rows?)
Excel reports? (5 different files?)
Power BI & Tableau? (different logic?)
Nobody knows. Everything breaks.
The Impact
⏳ Slow updates
😱 Inconsistent reports
🔥 Data integrity issues
💸 Lost productivity
With Star Schema
One update. One place. Everything updates automatically.
What Is Star Schema? (The Solution)
Star Schema organizes data into two types of tables:
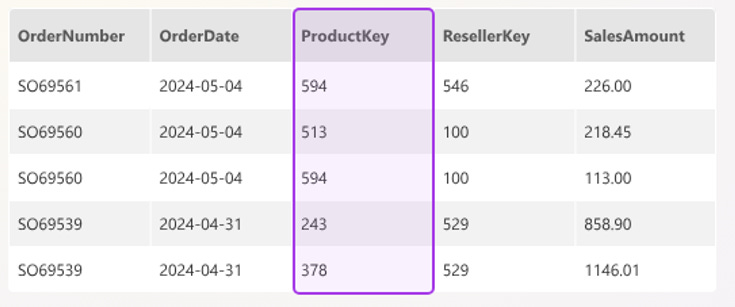
1. Fact Tables (Center of the Star)
Fact tables store measurable data — the numbers you analyze.
Example: fct_Sales
sales_key
customer_key
product_key
date_key
order_amount
units_sold
discount
tax
Rule: Only numbers + foreign keys. No descriptions.
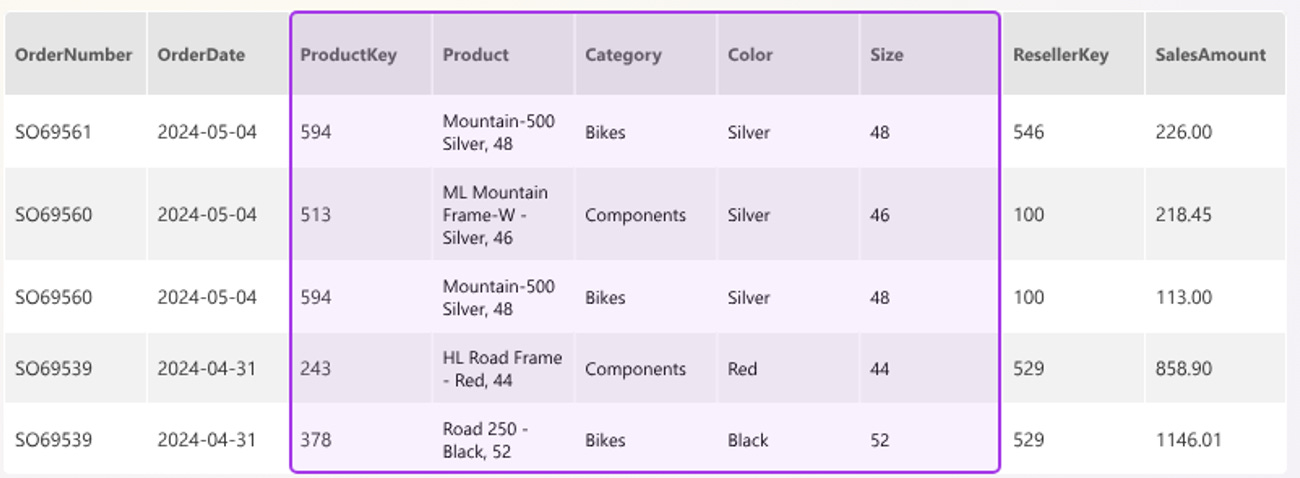
2. Dimension Tables (Context Around the Star)
Dimension tables store descriptive attributes.
dim_Product
product_key
product_name
category
brand
price
dim_Customer
customer_key
name
email
segment
region
dim_Date
date_key
date
month
quarter
year

How They Connect
fct_Sales.customer_key → dim_Customer
fct_Sales.product_key → dim_Product
fct_Sales.date_key → dim_Date
This enables fast, consistent analysis.
Normalization vs Denormalization (The Confusion)
Normalization (Operational Systems)
Used in: Banking, transactions, apps
Pros:
No redundancy
Accurate updates
Strong data integrity
Cons:
Too many joins
Slow for analytics
Complex
Denormalization (Analytics Systems)
Used in: Power BI, Data Warehouses
Pros:
Fast queries
Simple structure
Easy for business users
Cons:
Redundancy
Slower updates
The Truth
You need both:
Operational DB → Normalized (fast writes)
Data Warehouse → Star Schema (fast reads)
Star Schema vs Snowflake Schema
A snowflake schema is a variation of a star schema where dimension tables are further normalized into multiple related tables (e.g., product → category → subcategory), reducing redundancy but increasing the number of joins required for queries.
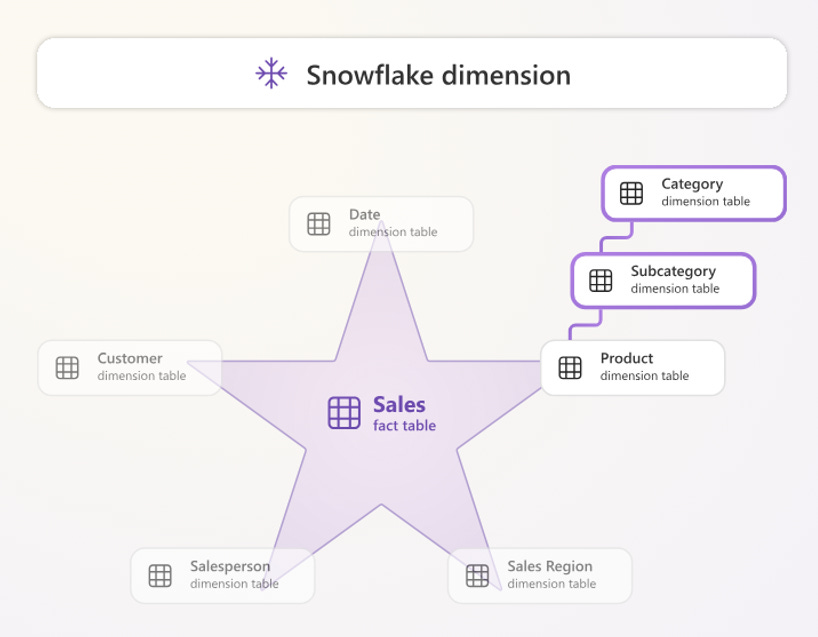
It is typically used when data storage optimization, strict data integrity, or complex hierarchical relationships are more important than query speed—common in large enterprise data warehouses with highly structured dimensions.
However, star schema is generally preferred because it keeps dimensions in a single table, resulting in fewer joins, faster query performance, simpler models, and better usability in tools like Power BI, making it ideal for analytics and business reporting.
Key Takeaways
1. Solves Multiple Truth Problem
One source = consistent numbers.
2. Fact Tables = Numbers
Revenue, units, profit.
3. Dimensions = Context
Customer, product, date.
4. Denormalization = Speed
Faster analytics queries.
5. You Need Both Worlds
OLTP (normalized) + DW (star schema).
6. Star > Snowflake for Power BI
Less joins = faster performance.
7. One Change, Everywhere Updates
Update once → reflect everywhere.
How to Implement in Power BI
Step 1: Create Fact Table
fct_Sales with keys + measures.
Step 2: Create Dimensions
dim_Customer, dim_Product, dim_Date.
Step 3: Build Relationships
customer_key
product_key
date_key
Step 4: Create Measures
Revenue = SUM(fct_Sales[order_amount])
Profit = SUM(fct_Sales[profit_amount])
Units = SUM(fct_Sales[units_sold])
Step 5: Build Reports
Use dimensions for slicing/filtering.
Resources: Star Schema Code + ReadMe file
Questions?
What’s your biggest challenge in data modeling?
Are you using star schema already?
Want a deeper dive on something specific?
Drop a comment — I read everything.
Subscribe for more practical guides on data analytics, AI tools, and building a high-value analyst career.
Stay analytical. Stay curious.
Atikant Jain
Your Analytical Guy
admin@analyticalguy.tech